
Global Warming and the Leftist War on Western Industrial Society, Parts I and II
FERDINAND BARDAMU

Graph showing that Roman and Medieval Warm Periods were warmer than today
Part I: The “Global Warming” Scandal
“In questions of science, the authority of a thousand is not worth the humble reasoning of a single individual.”- Galileo Galilei
Climate scientists and environmental activists have distorted the evidence of climate change in the service of a leftist political agenda. The continuous fluctuation in average global temperatures across vast geological timescales are completely ignored in favor of a manipulated data set, one supporting the UN’s drivel about man’s industrial activity being the most significant driver of modern-day climate change. The so-called “consensus” on anthropogenic or Human-Caused Global Warming (AGW) maintains that global atmospheric concentration of carbon dioxide (CO2) remained stable for millions of years, but increased from 280 ppm in 1750 to a maximum of 414.7 ppm in 2019. In support of this mainstream “consensus,” researchers write: “[T]he current CO2 concentration is unprecedented over the past 3 million years … global temperature never exceeded the preindustrial value by more than 2°C during the Quaternary” (Willeit et al., 2019). Mann et al.’s “hockey stick” (1998) graphically depicts a sharp increase in mean global temperatures from 1850 until present, after centuries of climate stability.
In pre-industrial times, incoming solar radiation would have been reflected off earth’s surface and back into outer space as thermal energy. This changed with the rapid growth in annual fossil fuel consumption since 1900, which has increased atmospheric CO2, considered a greenhouse or “heat-trapping” gas (GHG). Anthropogenic CO2, by absorbing thermal energy instead of letting it escape into outer space, has caused mean global temperatures to rise, a process known as the “greenhouse effect.” NASA’s Goddard Institute for Space Studies (GISS) estimated that “average global temperature on Earth has increased by about 0.8° Celsius (1.4° Fahrenheit) since 1880. Two-thirds of the warming has occurred since 1975, at a rate of roughly 0.15-0.20°C per decade.”[1]
Belief in the dangers of AGW has led to the emergence of the new generalist or interdisciplinary field of “climate science,” cobbled together with the express purpose of manufacturing evidence in favor of AGW. Significant differences exist between this climate science and the natural sciences. Regular scientists rely on objective, empirical methods to test hypotheses, not confirmation bias to uphold a neoliberal globalist status quo. Climate researchers, on the other hand, are heavily invested in filtering data through the lens of a single interpretation; they are trained to ignore all hypotheses, with the exception of AGW, no matter how plausible. In the natural sciences, governments will fund competing theories; in climate science, only AGW receives funding because it is the only politically correct explanation. Climate scientists are expected to uncover positive correlations between atmospheric CO2 and global temperature; if they cannot find one, they will manufacture one out of thin air. Not only is there no money in seeking alternative explanations of climate change, but any attempt at falsifying the AGW hypothesis is considered heresy. A similar state of affairs exists in the field of differential psychology; here, any exploration of race and sex differences in g-factor intelligence is considered taboo, and there is no funding available for such research.
Climate change activists are lionized by the establishment. Former American VP Al Gore conducted a flashy campaign to raise awareness of AGW; in 2007, he was awarded the Nobel Peace Prize, along with  the UN’s IPCC (Intergovernmental Panel on Climate Change). In contrast, those who question the IPCC’s findings are dismissed as cranks challenging a well-established scientific “consensus,” despite significant disagreement among scientists over whether AGW is a real phenomenon or not. Evidence of credible opposition is easily found, even though AGW proponents see these dissidents as shills for “big tobacco” or “big oil.” The Heidelberg Appeal, signed in opposition to the UN-backed Earth Summit’s AGW agenda (1992), was endorsed by over 4,000 scientists and 70 Nobel Laureates. Opponents were worried about “the emergence of an irrational ideology which is opposed to scientific and industrial progress and impedes economic and social development.”[2]
In 1998, over 31,000 scientists and experts signed the Oregon Petition, which urged “the United States government to reject the global warming agreement that was written in Kyoto, Japan in December, 1997, and any other similar proposals.” The petition continues:
“The proposed limits on greenhouse gases would harm the environment, hinder the advance of science and technology, and damage the health and welfare of mankind.
There is no convincing scientific evidence that human release of carbon dioxide, methane, or other greenhouse gases is causing or will, in the foreseeable future, cause catastrophic heating of the Earth’s atmosphere and disruption of the Earth’s climate.”[3]
Climate scientists forget that science is not done by consensus, but by hypothesis and experimentation. In his Third Letter on Sunspots (1612), Italian physicist Galileo Galilei wrote: “In questions of science, the authority of a thousand is not worth the humble reasoning of a single individual.” The IPCC’s environmental activists believe that deliberate suppression of scientific research challenging the supposed AGW “consensus” is in the best interests of citizens.
Unlike researchers in other disciplines like geology, climate scientists have been known to bully and threaten academics who were skeptical of AGW. They are not above using ad hominem rhetoric or childish name-calling to silence legitimate debate, revealing the intellectual bankruptcy of climate science’s defenders. Geologists and other researchers are repeatedly dismissed as “climate deniers,” a favorite term of abuse among environmental activists. It is an odd accusation to hurl at dissenters from mainstream “consensus,” since no scientifically literate person denies that climate always changes.
 In 2008, NASA’s James Hansen (see featured image), whose testimony before US Congress in 1988 (pictured right) began the global warming hysteria, demanded that fossil fuel company CEOs be tried for “crimes against humanity.” Apparently, prosecution for thought-crime is warranted because they refuse to accept mainstream “consensus” on AGW. In 2014, the pro-global warming documentary Merchants of Doubt smeared noted American physicist Fred Singer as a “liar.” Singer threatened to sue the film director for libel unless an amicable settlement could be reached out of court.[4] By the early 21st century, climate science had revealed itself to be just another totalitarian arm of the modern liberal-leftist police state, no different from the Soviet pseudoscience of Lysenkoism, whose manufactured “consensus” was also upheld through repression of dissenting scientists.
In 2009, a server at the University of East Anglia’s Climate Research Unit (CRU) was hacked and thousands of emails were leaked. These emails revealed a world seldom seen by the public, where outright fabrication, manipulated data and willful suppression of evidence had replaced scientific objectivity. Free from the glare of public scrutiny, the CRU disregarded scientific method in pursuit of a political agenda.
The emails tell a tale of corruption at the highest levels of academia. A climate scientist who had uncovered a decreasing trend in Northern Hemispheric temperatures was told to “hide the decline” using “Mike’s Nature trick.” Through padding with “instrumental” or thermometer data, the proxy temperature record was adjusted to reflect mainstream “consensus.” Freedom of Information (FOI) requests were routinely evaded and incriminating emails hurriedly deleted. Scientists who disagreed with the CRU were ridiculed and bullied. The scandal, known as “Climategate,” revealed a conspiracy among scientists to feed biased information to the IPCC.[5] In the aftermath, the CRU’s top scientists narrowly evaded criminal prosecution because of a legal technicality.[6]
Part II: The “Global Warming” House of Cards
When making their case to the public, environmental activists typically “prove” AGW using two pieces of evidence: an imaginary scientific “consensus” and Mann’s “hockey stick.” The specific claim of an overwhelming “consensus” on AGW within the scientific community comes from Cook et al. (2013), a team of volunteers affiliated with SkepticalScience.com, a pro-AGW website. The study, which found that 97% of the scientific community endorsed AGW, was one of the most downloaded and frequently cited papers in environmental science. Re-analysis of the data revealed significant bias and unrepresentative sample sizes. Cook et al. had excluded 75% of all papers discussing climate change. Geologists have long known about climatic fluctuations across vast geological timescales, but studies from the earth sciences were woefully undersampled. Cook and his team of volunteers were also taken to task for mistaking “a trend in composition for a trend in endorsement” (Tol, 2014). To this day, they have not responded to any of these major criticisms.
In 2017, geographer José Carlos González-Hidalgo at the University of Zaragoza in Spain estimated that, to the extent there was any agreement on AGW, there was a 50% “consensus,” as opposed to the 97% that was previously claimed by environmental activists. The supposed AGW “consensus” was only a myth disseminated by UN propaganda.
Mann’s iconic “hockey stick” graph (1998), the centerpiece of the IPCC’s environmental policy, ignited a firestorm of controversy and debate in the early 2000s, thanks to the efforts of Canadian researchers. The original graph reconstructed mean fluctuations in Northern Hemispheric temperature over a span of 600 years; although relatively stable for 500 years, the temperature increased dramatically after 1900. The trend, when depicted graphically, forms a hockey stick, hence the name. The Canadians McIntyre and McKitrick (2003), after re-analyzing Mann’s data, concluded that it was “primarily an artefact of poor data handling, obsolete data and incorrect calculation of principal components.” Their re-analysis also uncovered a “Medieval Warming Period”; temperatures were actually higher in the late fifteenth century than in the late twentieth. In 2005, McIntyre and McKitrick criticized the “hockey stick” graph’s underlying statistical methodology:
[P]rior to their principal components (PCs) analysis on tree ring networks, they carried out an unusual data transformation which strongly affects the resulting PCs. Their method, when tested on persistent red noise, nearly always produces a hockey stick shaped first principal component (PC1) and overstates the first eigenvalue.
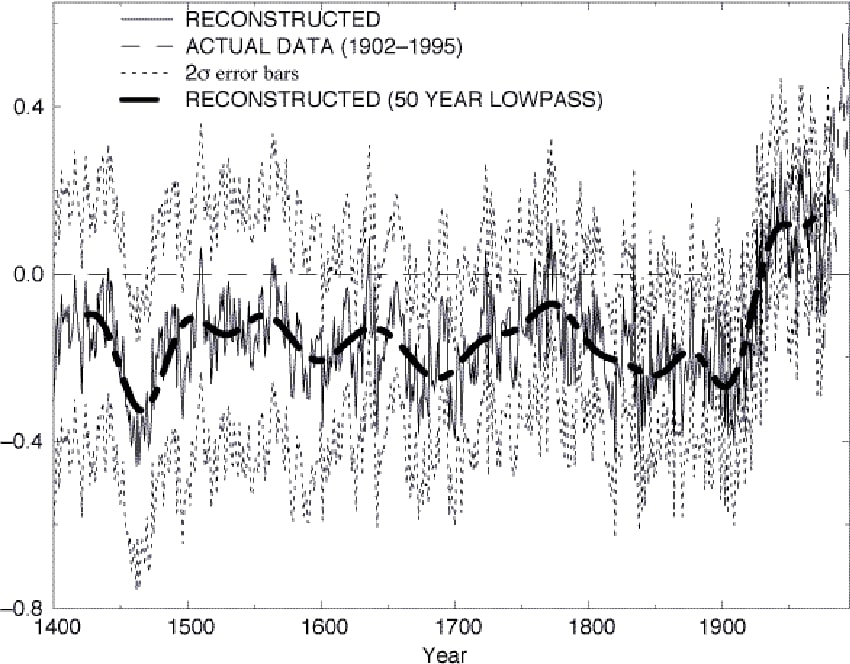
Original “hockey stick” graph, 1998. The Y axis shows the Northern hemisphere mean temperature, in degrees Celsius; the zero line corresponds to the 1902 – 1980 mean (Mann et al., 1998).
In layman’s terms, Mann’s algorithm “mined for hockey stick shapes and overstated their dominance in the underlying data patterns; … it understated the uncertainties of the resulting climate reconstruction ” (McKitrick, 2014). The proxy temperature data for the “hockey stick” was based on tree ring analysis of bristlecone and foxtail pines, making the research even more problematic. Paleoclimatic reconstructions using these tree species are not accurate because ring width is influenced by soil conditions, amount of sunlight and rainfall, humidity and availability of CO2, all of which must be disentangled before the data can be properly interpreted.
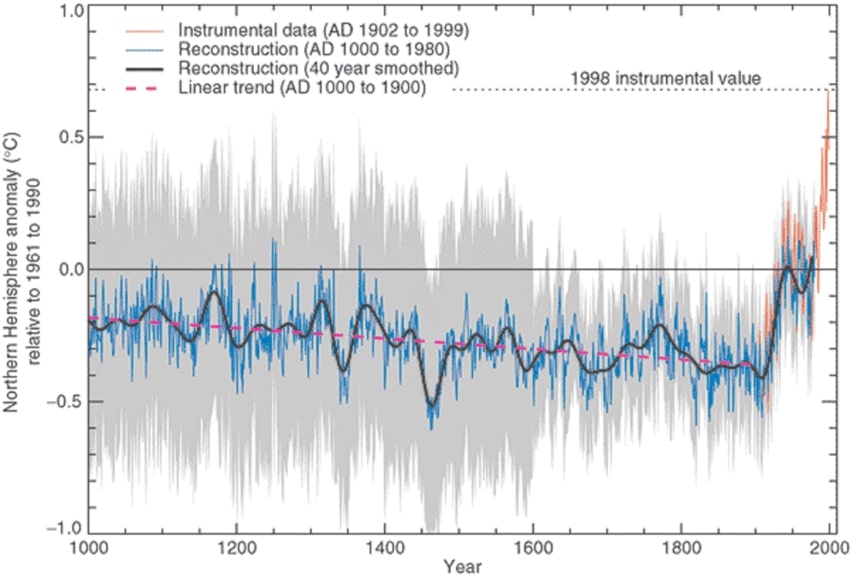
Third IPCC report’s version of Mann’s Hockey Stick
Initially, academics were denied access to Mann’s “hockey stick” data. McKitrick (2014) writes:
Mann put obstacles in place for subsequent researchers wanting to obtain his data and replicate his methodologies, most of which were only resolved by the interventions of US Congressional investigators and the editors of Nature magazine, both of whom demanded full release of his data and methodologies some six years after publication of his original Nature paper.

McIntyre & McKitrick’s corrected version of Mann’s graph (2003). Note that the 15th century is warmer than the 20th.

Updated reconstruction of McIntyre & McKitrick’s corrected version of Mann’s graph (Florides & Christodoulides, 2008)
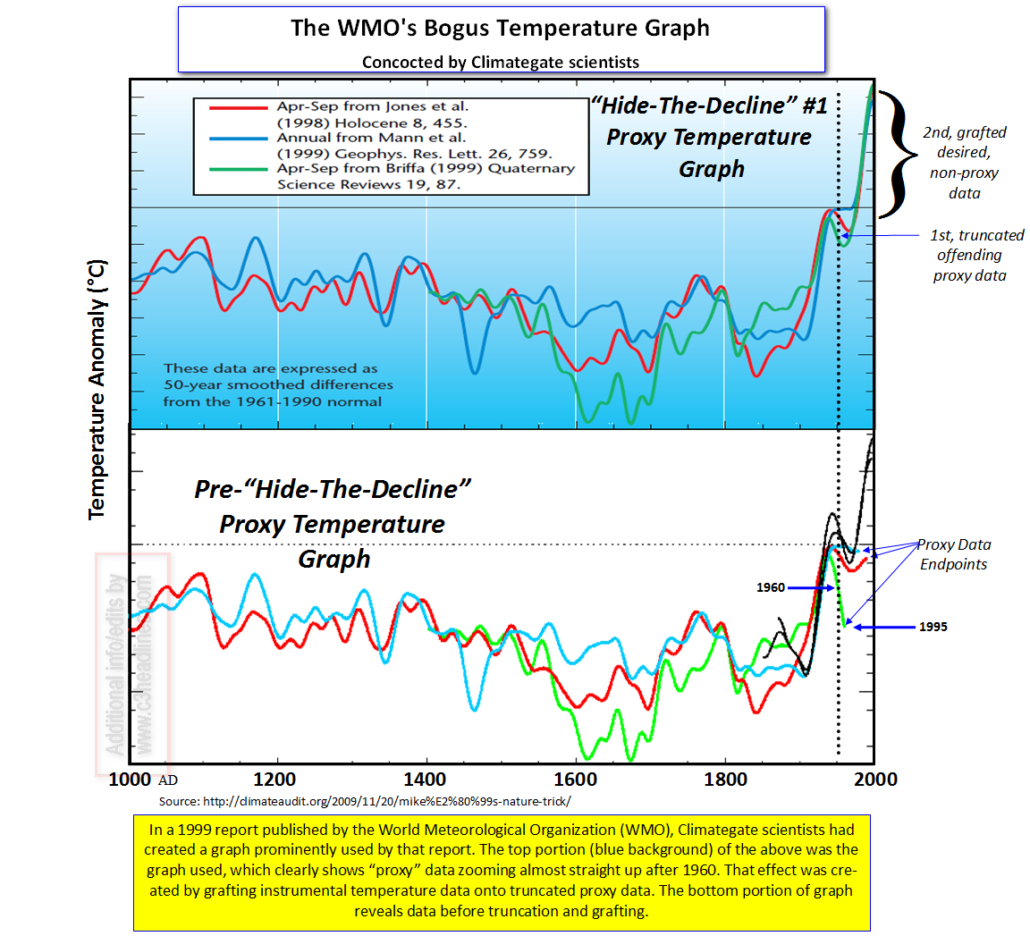
The bogus hockey stick graph used by Climategate scientists to hide the decline,before and after
There are other problems with the case for AGW. The “greenhouse theory” of AGW is unproven and misleadingly presented. Recreating the earth’s atmosphere in a laboratory setting is physically impossible; the greenhouse effect only occurs within an enclosed structure, not an open system. Comparing the earth’s atmosphere to a greenhouse is thus highly misleading. In Schroeder’s Introduction to Thermal Physics (2000), solar radiation is presented as passing through a transparent atmosphere, which is emitted as thermal infrared energy by the earth’s surface; since the atmosphere is opaque to thermal infrared energy, it is then radiated back to the surface, raising average surface temperatures in the process. “This mechanism,” writes Schroeder, “is called the greenhouse effect … though most greenhouses depend primarily on a different mechanism (namely, limiting convective cooling)” (pg, 306).
In other words, climate change activists say that the earth’s atmosphere is like a greenhouse, but in an actual physical structure like a greenhouse, solar energy passes through the glass, heating surfaces within. It is then emitted by these surfaces as thermal infrared energy, but this cannot escape because of the glass. The glass traps the energy inside, inhibiting convective heat loss. This raises the temperature of the greenhouse. The heating of the earth is not like a greenhouse for two reasons: a) thermal energy is still able to escape from earth’s atmosphere, and b) heating occurs because the atmosphere is partially opaque to earth’s re-radiated thermal (infrared) energy, not by inhibiting convection (heat transfer by air or liquid).
A planetary greenhouse effect is an unfalsiable hypothesis because an actual greenhouse is a closed system (i.e. traps thermal energy) whereas the earth’s atmosphere is an open system (i.e. allows thermal energy to escape). You cannot recreate an open system like the earth’s atmosphere in a laboratory.
We have seen that AGW is based on fabricated or manipulated data; unbeknownst to the public, the AGW hypothesis is contradicted by a large body of experimental evidence. Contrary to the IPCC, CO2 can only absorb so much thermal energy radiated by earth’s surface until reaching a saturation point (Archibald, 2007). Once it has been reached, CO2’s ability to absorb thermal energy decreases logarithmically. A doubling or even tripling of atmospheric CO2 does not lead to rapid average global temperature increases. This explains why past geological eras, i.e. the Paleozoic, had 2 to 15 times the amount of atmospheric CO2 we have now (which is 414.7 ppm), but did not experience a runaway greenhouse effect. When dinosaurs first appeared during the Triassic, CO2 already exceeded 1000 ppm.[7]

Unlike a real greenhouse that restricts heat escape by preventing convection, the earth is heated by “greenhouse gases” that absorb outgoing thermal energy, re-emitting some of it back towards Earth
There have been periods that were significantly warmer than the present, such as the Holocene Climatic Optimum and the Medieval Warming Period. Temperatures over 6,000 years ago were 3ºC higher than they are now. This is confirmed by paleoclimatic reconstructions of Canadian Arctic and Russian temperatures (Fortin and Gajewski, 2016). Those who push Green dogma face a conundrum: How can AGW be true if the late Middle Ages and the Holocene were much warmer than the present?
Embarrassingly enough for the “Church of Climate Change,” Fyfe et al. (2016) found that there was a “global warming slowdown” from 2000 to 2014, despite increasing anthropogenic GHG emissions.
Some argue that the decreasing C13 / C12 isotope ratio of atmospheric CO2 is an anthropogenic signal, but another study found that these trends actually mirror natural C13 / C12 variability during interannual fluctuations of sea surface temperatures (Spencer, 2012, pg. 130).
That CO2 causes global temperatures to rise is axiomatic among climate change activists. But how well supported is this belief? Pedro et al. (2012) reported that, during deglaciation, rising Antarctic temperatures preceded increases in CO2. Using Antarctic and Greenlandic ice cores, they were able to show that atmospheric CO2 has lagged temperature since the Late Paleolithic. Rising CO2 is attributed to unspecified biogeochemical processes occurring in the ocean, further implicating temperature as the variable that is modulating CO2 variation, rather than vice versa.
There is some indication that if CO2 increases, temperature will actually either increase less rapidly or even decrease, indicating a negative correlation. Changes in temperature and CO2variation occur on ocean and land surfaces first, before affecting the lower troposphere. Further, global changes in atmospheric CO2 concentration are non-anthropogenic, since they occur near the equator before spreading to the poles, not in the industrialized North as expected if AGW was true (Humlum et al., 2013). Not only that, other data reveal no correlation between fossil fuel emissions and concentration of atmospheric CO2 (Munshi 2017). Investigators have tentatively hypothesized why CO2 lags temperature: the solubility of CO2 in the ocean waters decrease as temperatures rise, leading to “net outgassing” of CO2 into the atmosphere.
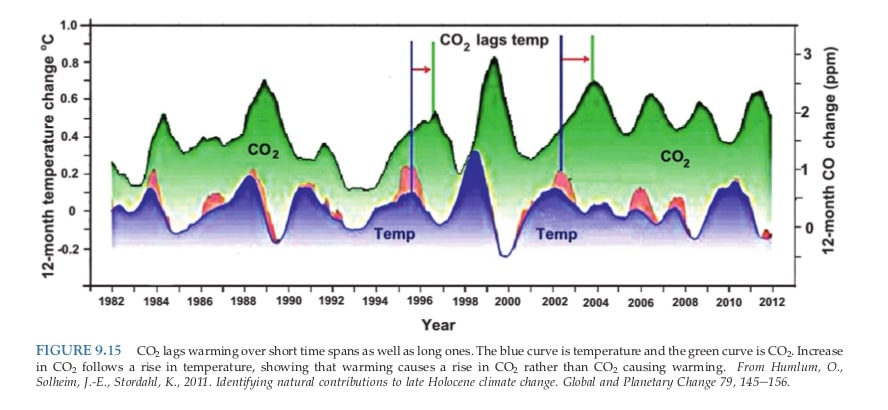
CO2 lags temperature, not vice versa, as would be expected if AGW was correct ( Humlum et al., 2013)
Climate physicist Edwin X. Berry (2019) dismantles the IPCC’s “Bern model,” which supposedly explains atmospheric accumulation of anthropogenic CO2. The IPCC believes that increasing anthropogenic CO2 reduces ocean buffer capacity; if the ocean can’t absorb excess CO2, it remains trapped in the atmosphere with nowhere to go. If this were true, concentration of atmospheric CO2 would be many times higher than it is now, given significant average temperature and CO2 variation across vast geological timescales. The IPCC apparently believes that anthropogenic and non-anthropogenic CO2 have the same molecular formulas but different molecular structures, a preposterous assumption that violates the laws of both chemistry and physics.
If a model is to retain its validity, it must supply us with an explanation that best fits the data. Berry’s simple mathematical model, which “shows how CO2 flows through the atmosphere and produces a balance level where outflow equals inflow,” is empirically supported by C14 data. After nuclear testing during the 1950s and 60s, there was a temporary accumulation of C14 in the atmosphere, which eventually dissipated after 1970. In order for the Bern model to be correct, man-made CO2 would have remained trapped in the atmosphere. The C14 data shows this to be false, forcing us to conclude that Berry’s “physics model” best fits the data.
The IPCC maintains that, because anthropogenic CO2 increased faster than naturally occurring CO2 after 1750, growth in atmospheric CO2 between 1750 to 2013 has been entirely anthropogenic. As the study author points out, this is a non sequitur:
[T]he fact that the sum of human emissions is greater than the increase does not prove human CO2 caused the increase. The IPCC argument omits natural CO2which totaled about 6000 ppm during the same period, much larger than the sum of human CO2.
The IPCC’s contention that non-anthropogenic CO2 does not increase total atmospheric CO2 because nature is a sink is patently ridiculous:
Of course, nature is a ‘net carbon sink’ because nature absorbs human CO2emissions. However, absorption of human CO2 has no bearing whatsoever on how much natural CO2 flows into the atmosphere. Nature can set its inflow as it pleases, no matter how much human inflow nature absorbs.
There is no “climate control knob,” as the IPCC and its globalist lackeys like to believe. We have as much control over the climate as King Canute of England had over the tides of the river Thames. AGW is a pious fraud, one based on spurious correlation and post hoc ergo propter hoc.
But if temperature decreases CO2 solubility in ocean waters, as evidence suggests, what leads to rising average global temperatures?
There is evidence that climate change is modulated by variability of solar magnetic flux, although the precise mechanism is still debated by physicists. The most common theory is that sunspot activity and cosmic ray intensity are inversely correlated. During low sunspot activity, expansion of the sun’s corona produces faster and stronger solar winds, shielding the heliosphere from interstellar cosmic radiation needed for cosmogenic ionization of aerosols. Without enough of these charged particles, there are less cloud condensation nuclei (CNNs) available as “surface” area for water vapor condensation. In the absence of cloud cover, incoming solar radiation will not be reflected back into outer space, raising average global temperatures (Svensmark, 2019). This is far more convincing than AGW, in addition to being supported by actual experimental evidence.

Changes in sunspot activity caused climatic changes in the past (i.e. the Medieval Warm Period and Little Ice Age)

Illustration of Svensmark’s theory, explaining how solar activity causes climate change (2019)
The question remains to be asked: If AGW is so obviously wrong, why do the IPCC and their globalist lackeys continue to promote this falsehood as if it were actually true?
************
Original article
[1]“World of Change: Global Temperatures.” Nasa.Gov, NASA Earth Observatory, 9 Dec. 2010, earthobservatory.nasa.gov/world-of-change/DecadalTemp.
[2]Goldstein, Leo. “Heidelberg Appeal’s Anniversary – 4,000+ Scientists, 70 Nobel Laureates.” Science Defies Politics, 26 Sept. 2018, defyccc.com/heidelberg-appeal-anniversary/. Accessed 8 Sept. 2019.
[3]—. “Oregon Petition (1998) Signed by 31,000+ Scientists and Experts.” Science Defies Politics, 9 June 2019, defyccc.com/oregon-petition/. Accessed 8 Sept. 2019.
[4]Morano, Marc. “Merchants of ‘Smear’ Movie Slanders Eminent Physicist Dr. Fred Singer – Singer Fires Back!” Climate Depot, 6 Mar. 2015, www.climatedepot.com/2015/03/06/merchants-of-smear-movie-slanders-eminent-physicist-dr-fred-singer-singer-fires-back/. Accessed 8 Sept. 2019.
[5]For further information, see The Climategate Emails, edited and annotated by John Costella (2010).
[6]Derbyshire, David. “New Scandal as ‘Climate Gate’ Scientists Accused of Hiding Data from Global Warming Sceptics.” Mail Online, Daily Mail, 28 Jan. 2010, www.dailymail.co.uk/news/article-1246661/New-scandal-Climate-Gate-scientists-accused-hiding-data-global-warming-sceptics.html. Accessed 8 Sept. 2019.
[7]“File:Phanerozoic Carbon Dioxide.Png – Wikimedia Commons.” Wikimedia.Org, 2009, commons.wikimedia.org/wiki/File:Phanerozoic_Carbon_Dioxide.png. Accessed 8 Sept. 2019.

••••
The Liberty Beacon Project is now expanding at a near exponential rate, and for this we are grateful and excited! But we must also be practical. For 7 years we have not asked for any donations, and have built this project with our own funds as we grew. We are now experiencing ever increasing growing pains due to the large number of websites and projects we represent. So we have just installed donation buttons on our websites and ask that you consider this when you visit them. Nothing is too small. We thank you for all your support and your considerations … (TLB)
••••
Comment Policy: As a privately owned web site, we reserve the right to remove comments that contain spam, advertising, vulgarity, threats of violence, racism, or personal/abusive attacks on other users. This also applies to trolling, the use of more than one alias, or just intentional mischief. Enforcement of this policy is at the discretion of this websites administrators. Repeat offenders may be blocked or permanently banned without prior warning.
••••
Disclaimer: TLB websites contain copyrighted material the use of which has not always been specifically authorized by the copyright owner. We are making such material available to our readers under the provisions of “fair use” in an effort to advance a better understanding of political, health, economic and social issues. The material on this site is distributed without profit to those who have expressed a prior interest in receiving it for research and educational purposes. If you wish to use copyrighted material for purposes other than “fair use” you must request permission from the copyright owner.
••••
Disclaimer: The information and opinions shared are for informational purposes only including, but not limited to, text, graphics, images and other material are not intended as medical advice or instruction. Nothing mentioned is intended to be a substitute for professional medical advice, diagnosis or treatment.


