England’s vaccine ‘police’ hunt the unvaccinated
BUT VACCINES ARE INCREASING CASES BY HUNDREDS OF THOUSANDS IN THE VACCINATED
FORENSIC
The conversation
I am away for the Christmas holidays with my family in England. At the evening meal on Christmas day in the hotel, two older couples were engaged in conversation about wearing masks, and one side made the reasonable observation that in the past we have had 1000s of deaths attributed to flu but we didn’t wear masks then.
The conversation progressed to them agreeing, though, that the unvaccinated were filling-up the hospitals and it’s their own fault, as they have been offered the vaccine. At that point I was getting up to politely join the conversation but my eldest pleaded for me to stay seated: it’s really embarrassing, dad! It really did take every ounce of strength to not speak to those people but it was my one day off with my family and I didn’t want to rock the boat so, just this once, I thought. I remained seated and continued on with the meal.
The data
Later that evening I looked at the latest Data from England, that is regularly published and comprehensive. Its results are alarming and I will cover them in a moment. Particularly alarming when you contrast them with the latest government initiative that I was alerted to at breakfast the next day.
‘I am all in favour of free choice but there comes a point when you cannot lock up 90 per cent of the country who are vaccinated for the ten per cent who refuse to be.’
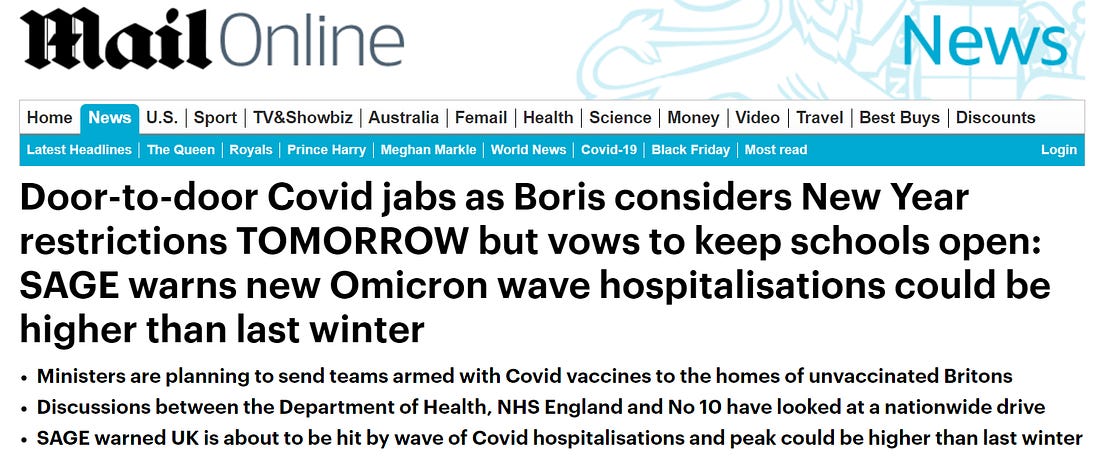
The situation is so bad in the UK, apparently, that vaccinators must go to people’s doors hunting those that are to blame: the unvaccinated. And get them to take the shot.
…But if there is any blame, who exactly deserves it?
The unvaccinated are not filling-up the hospitals
England publishes relatively raw data on Covid-19 but comes to conclusions that don’t add up. So I wanted to analyse what really is going on in England with Covid-19
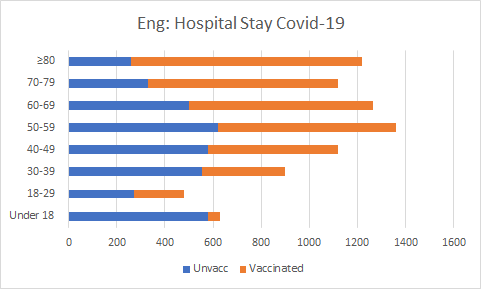
I started by plotting the data from England regarding hospitalisation associated with Covid-19 cases. *
*Of course, we know that means being positive for Sars-Cov-2 on a test entering hospital regardless of why you are there.
Figure 1. Covid-19 case hospitalisation in England by vaccination status
Fig. 1 A graph of Covid-19 cases hospitalised in England by vaccination status. There really is very little between vaccinated and unvaccinated numbers.
Data source. COVID-19 vaccine surveillance report Week 51.
The graph (fig. 1) clearly shows that, contrary to the claims being made in the media and repeated in conversations across the UK, that the unvaccinated are not filling-up the hospitals. Both vaccinated and unvaccinated are represented in pretty much equal measure.
One of the criticisms of data such as that above is well, there are more vaccinated so there should be a lot of vaccinated people in hospital and less unvaccinated, therefore, the unvaccinated seem to be over represented in hospital. In real terms, that doesn’t change the fact that the unvaccinated certainly are not filling-up the hospitals but let’s take that criticism into account.
The real hospitalisation data
To get an accurate picture of covid-19 cases in hospital and remove the bias of large numbers of the population now being vaccinated, we can allow for those population numbers.
First, I calculated the actual risk reduction between the two groups vaccinated & unvaccinated. I used age-stratified population data showing just how many people have or have not been vaccinated in each age-group and used that with the hospitalisation data to calculate an accurate hospitalisation risk reduction.
Then, once the absolute risk reduction (ARR) for each age group is known, it is clearer to see the net benefit or loss from being vaccinated.
The numbers show no difference in hospitalisation
By calculating the ARR, it is apparent that the risk differences for vaccinated compared to unvaccinated by age-groups for hospitalisation range from 1/100th of one percent at its lowest, to just under a quarter of one percent at its highest.
So, effectively, even after removing any potential skew in the data due to large numbers being vaccinated, the real risk of being hospitalised for Covid-19 in England is the same for the vaccinated & unvaccinated. And by the way, the data are being grossly misrepresented in the conclusions of government reports, fueling fear and mistrust. So let’s resolve that.
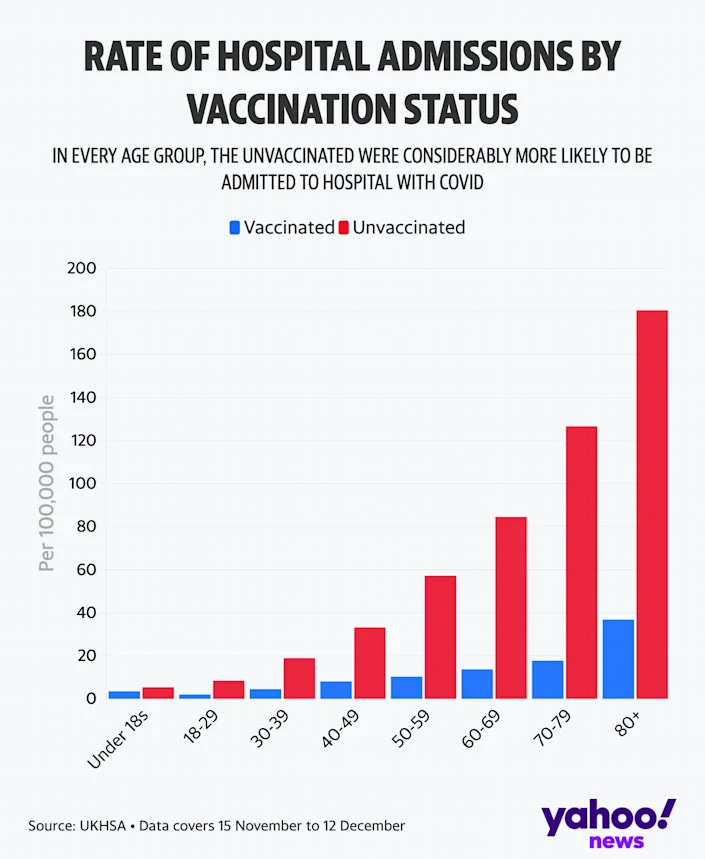
Figure 2. Gross misrepresentation of England’s hospitalisation data
Fig. 2 Rates of hospitalisation by age group from UKHSA grossly misrepresents actual hospitalisation data.
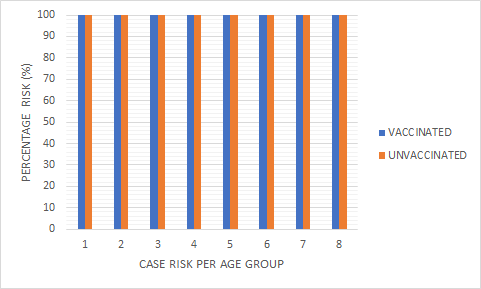
Figure 3. Risk of vaccinated being hospitalised in England compared to the unvaccinated.
Fig. 3 Each bar represents the potential risk of hospitalisation with Covid-19, per age group. Anything lower than 100(%) would indicate a lower risk; or above 100(%), a greater risk. 100(%) indicates that the group has 100% of the potential risk of hospitalisation. The chart clearly demonstrates that the vaccinated have no reduction in potential risk of hospitalisation compared to the unvaccinated.
Data sources. COVID-19 vaccine surveillance report Week 51; Weekly national Influenza and COVID-19 surveillance report Week 51 report (up to week 50 data) 23 December 2021.
So, we can see that the government data, reasonably interpreted, demonstrate no real difference in risk for hospitalisation between vaccinated & unvaccinated. The unvaccinated were not more likely to be admitted to hospital and were not over represented.
But what of mortality?
It doesn’t make sense to come to the conclusion that Covid-19 vaccination reduces mortality, when all other data demonstrate its failure; as we have discussed here and in previous articles. That is important because we hear reports of the unvaccinated, for example, filling-up ICU units; claimed in various iterations.
I’ll reproduce some data here from Something Abnormal lies Buried in England’s Death Data to make the point.
Early and ongoing analysis of Covid-19 mortality data demonstrates the following:
- Mortality appears to go up after vaccination, usually within the first week or two.
- The definition of being ‘vaccinated’ [wait 14 days after vaccination to be deemed vaccinated with 1 dose] avoids those mortality data being put in the Vaccinated total.
- Similarly, by only being fully vaccinated 14 days after 2 doses, a whole chunk of data are removed from the vaccinated and mis-categorised as unvaccinated, potentially skewing any fair and unbiased comparison to the unvaccinated. Of course, the goal posts are moving again, with a 3rd; 4th; and X number of doses. Falsely adding the previously fully vaccinated to the unvaccinated column.
We have a definition problem, or should I say conjurer’s trick, going on here. And the first question that should be asked, for example, if unvaccinated ICU data are claimed: by what definition are they ‘unvaccinated’: 1 shot; 2 shots but no booster; or truly not vaccinated?
We saw problems with mortality in early trial data and reports.
FDA report shows Pfizer’s clinical trials found 24% higher all-cause mortality rate among the vaccinated compared to placebo group.
For long term care facility (LTCF) residents, the CDC initially stated:
Reported deaths occurred 0–20 days after vaccination (median = 2 days)
And for non-LTCF deaths;
The median interval from vaccination to death was 3 days (range = 0–20 days).
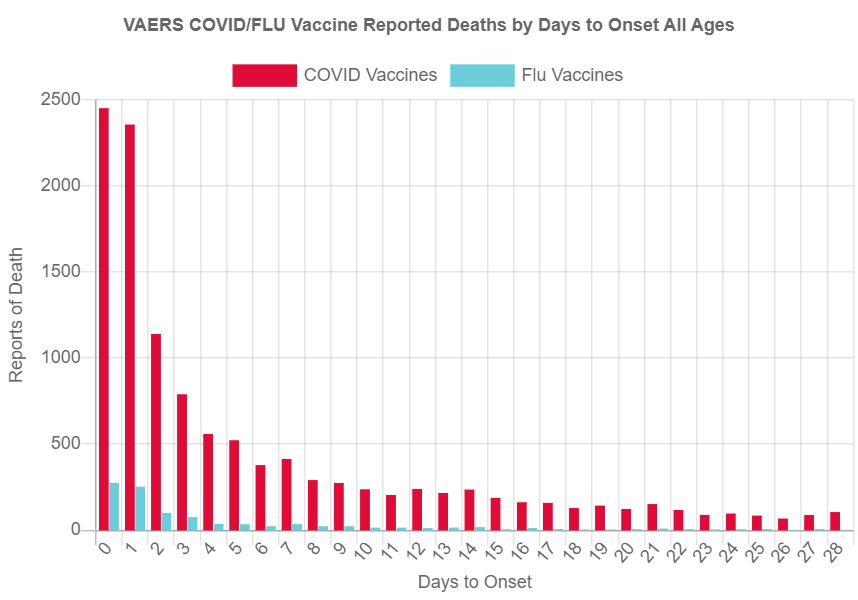
Just a cursory look at VAERS, with all its caveats, it’s not that difficult to see an early rise in mortality associated with vaccination, that in part explains the [increase in mortality] observations.
Fig. 1 VAERS Covid-19 and flu mortality after vaccination
Source: OpenVaers
VAERS data demonstrate a significant rise in reported deaths associated with Covid-19 vaccines within two weeks post vaccination, with the main effect in the first 7 days. Comparison with influenza vaccines indicates orders of magnitude increase in reports.
Source Something Abnormal lies Buried in England’s Death Data
Prof. Norman Fenton and his colleagues have found gross anomalies in ONS mortality data discussed in detail in Something Abnormal lies Buried in England’s Death Data, and also the following publication.
Our analysis clearly suggests that, when compared to ONS death figures from week 26, all-cause mortality (UMR) for vaccinated people, compared to unvaccinated people, is certainly higher in single dosed individuals and slightly higher in those who are double dosed. [My emphasis]
Prof. Fenton’s thorough analysis of England’s mortality data actually demonstrates that vaccination is associated with an increase in death, not a decrease.
Of course, anything’s possible but given all of the above, does it make sense that the ICUs of England would be full of the truly unvaccinated?
England’s Covid-19 case data is astounding
I wanted to see the effect that the vaccination campaign has had on recent case numbers in England. Remember, we are using England’s data because it is very comprehensive and regularly published. And as England is a typical modern country, we are reasonably confident to apply our findings to other countries that have a similar make-up & infrastructure.
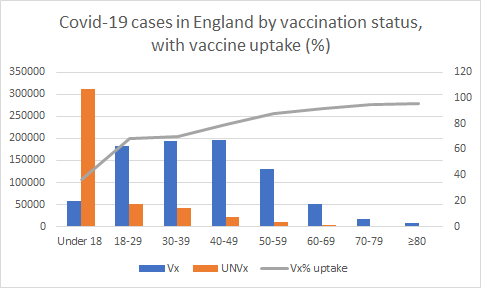
First I plotted the number of Covid-19 cases between the vaccinated & unvaccinated, with a line indicating the percentage of vaccine uptake.
Figure 4. Covid-19 cases in England by vaccination status, with vaccine uptake (%).
Fig. 4 The chart clearly demonstrates that apart from the youngest age-group, cases are dominated by the vaccinated & dwarfing the unvaccinated in large numbers.
Data sources. COVID-19 vaccine surveillance report Week 51; Weekly national Influenza and COVID-19 surveillance report Week 51 report (up to week 50 data) 23 December 2021.
The youngest age group has a larger number of unvaccinated cases. We saw that pattern in other groups in prior data that eventually swapped as more became vaccinated. I expect to see that happen with the under 18 group: the cases will swap, with the vaccinated dwarfing the unvaccinated.*
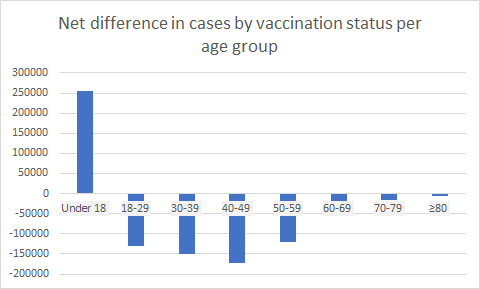
Figure 5. Net difference in Cases by vaccination status per age group
Fig. 5 The difference in cases between the vaccinated and the unvaccinated is 372,324 over a 3 week period. 372,324 more cases in the vaccinated groups. Bars above the zero line indicate the net increase in cases in the unvaccinated group; bars below the zero line indicate the net increase in cases in the vaccinated groups.
Data sources. COVID-19 vaccine surveillance report Week 51; Weekly national Influenza and COVID-19 surveillance report Week 51 report (up to week 50 data) 23 December 2021.
But once again, the criticism can be made that it’s just because so many people are vaccinated, that there are more cases in the vaccinated group.
*Explanations for that will have to be covered in another article but briefly may involve vaccine-induced immune tolerance in those vaccinated; & immune training of the unvaccinated in response to the ongoing pandemic.
The real case data
To resolve the problem of large numbers of vaccinated versus unvaccinated skewing the results, I calculated the absolute risk reduction (ARR) between the two groups. Age-stratified population data showing just how many people were vaccinated in each age-group were used with case data, ensuring that an accurate case risk reduction was arrived at.
Once the ARR for each age group was calculated, it was applied to a standard population to calculate the net benefit or loss (less or more cases) from being vaccinated.
Standard population
Standard population analysis gives us an idea of how a vaccine may perform, all things being equal. As it is a theoretical population we don’t quote the actual numbers (we could have used pretty much any population number) but we can use the difference in numbers to confirm if an increase in cases is actually occurring as a result of the vaccine.….And it is.
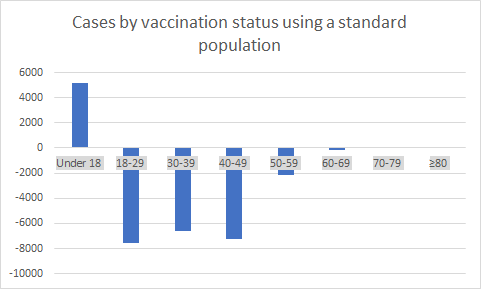
Figure 6. Covid-19 cases by vaccination status using a standard population.
Fig.6 Vaccination has caused an increase in cases in England, supported by using a standard population analysis. Bars above the zero line indicate the net increase in cases in a theoretical population in the unvaccinated groups; bars below the zero line indicate the net increase in cases in the vaccinated groups. The total of the bars is negative not positive, indicating an increase in cases due to vaccination. The Standard population created here is a theoretical population so we don’t quote the actual numbers but it confirms that the vaccine, after removing bias due to large numbers of the population being vaccinated, is causing an increase in Covid-19 cases.
Data sources. COVID-19 vaccine surveillance report Week 51; Weekly national Influenza and COVID-19 surveillance report Week 51 report (up to week 50 data) 23 December 2021.
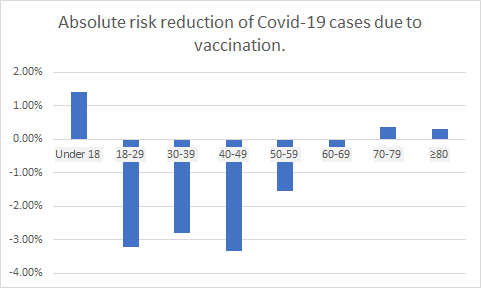
Figure 7. Absolute risk reduction of Covid-19 cases due to vaccination.
Fig. 7 The chart shows the absolute risk reduction (%) of Covid-19 cases in each age group due to vaccination. Those data, with the prior data presented, support the conclusion that vaccination has resulted in an increase in Covid-19 cases. Bars above the zero line indicate a net increase in cases in the unvaccinated group. Bars below the zero line indicate a net increase in cases in the vaccinated group.
The increase in cases due to vaccination are not exclusively in one age group (potentially skewing the numbers), but include nearly all age groups. Clearly, for most age groups, they are at more risk of infection if they are vaccinated.
Data sources. COVID-19 vaccine surveillance report Week 51; Weekly national Influenza and COVID-19 surveillance report Week 51 report (up to week 50 data) 23 December 2021.
Clearly, for most age groups, they are at more risk of infection if they are vaccinated.
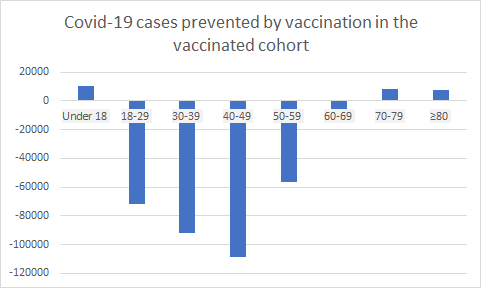
Arriving at an actual number of increased Covid-19 cases due to vaccination can depend on which group you focus on, but in terms of the vaccinated cohort, the chart below shows the cases prevented or caused by vaccination. I’ve applied the current ARR to England’s vaccinated cohort to estimate cases resulting from vaccination. A more detailed study will require averaging the results of ARR and vaccinated cohorts over time.
Figure 8. Covid-19 cases prevented by vaccination in the vaccinated cohort.
Fig. 8 Using case and population vaccine uptake data, ARR/NNT/NNH** were calculated and used to derive the number of Covid-19 cases prevented by vaccination in England’s vaccinated cohort.*** Bars above the zero line indicate cases prevented. Bars below the zero line (negative prevention) indicate cases due to vaccination. Clearly there is a significant increase in cases in the vaccinated cohort due to vaccination.
Data sources. COVID-19 vaccine surveillance report Week 51; Weekly national Influenza and COVID-19 surveillance report Week 51 report (up to week 50 data) 23 December 2021. **ARR (absolute risk reduction)/ NNH (numbers needed to harm)/ NNT (numbers needed to treat). *** Estimated at current ARR applied to England’s vaccinated cohort.
The age-stratified results shown in the above chart (fig. 8) using accurate risk analysis from case data and population vaccine uptake demonstrate that Covid-19 cases have increased in England’s vaccinated cohort as a direct result of being vaccinated. By how many?
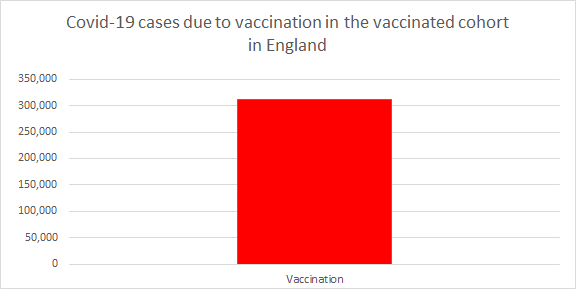
Figure 9. Increase in Covid-19 cases due to vaccination in England
Fig. 9 This chart depicts the estimated total number of Covid-19 cases in England’s vaccinated cohort due to vaccination that would not have happened, absent the vaccination. It totals 312,202 unnecessary Covid-19 cases.***
Data sources. COVID-19 vaccine surveillance report Week 51; Weekly national Influenza and COVID-19 surveillance report Week 51 report (up to week 50 data) 23 December 2021. *** Estimated at current ARR applied to England’s vaccinated cohort.
Figure 9 shows an estimated 312,202 Covid-19 cases due to vaccination in England’s vaccinated cohort based on the current ARR.
Summary
England’s Covid-19 data demonstrate that its hospitals are not full-up with unvaccinated people and the unvaccinated are not over represented. In fact, the vaccinated and unvaccinated are pretty much equal, even allowing for large numbers of vaccine uptake.
In terms of cases, it appears that England’s vaccination campaign is having the opposite effect: cases have significantly increased due to vaccination.
Analysis of mortality data demonstrate anomalies and an increase in death associated with those vaccinated compared to the unvaccinated.
Mandating or coercing vaccination against Covid-19 is counter productive and leads to an increase in Covid-19 cases and deaths.
SIMPLY PUT: YOU SHOULD BE OUTRAGED
************
Source

••••
The Liberty Beacon Project is now expanding at a near exponential rate, and for this we are grateful and excited! But we must also be practical. For 7 years we have not asked for any donations, and have built this project with our own funds as we grew. We are now experiencing ever increasing growing pains due to the large number of websites and projects we represent. So we have just installed donation buttons on our websites and ask that you consider this when you visit them. Nothing is too small. We thank you for all your support and your considerations … (TLB)
••••
Comment Policy: As a privately owned web site, we reserve the right to remove comments that contain spam, advertising, vulgarity, threats of violence, racism, or personal/abusive attacks on other users. This also applies to trolling, the use of more than one alias, or just intentional mischief. Enforcement of this policy is at the discretion of this websites administrators. Repeat offenders may be blocked or permanently banned without prior warning.
••••
Disclaimer: TLB websites contain copyrighted material the use of which has not always been specifically authorized by the copyright owner. We are making such material available to our readers under the provisions of “fair use” in an effort to advance a better understanding of political, health, economic and social issues. The material on this site is distributed without profit to those who have expressed a prior interest in receiving it for research and educational purposes. If you wish to use copyrighted material for purposes other than “fair use” you must request permission from the copyright owner.
••••
Disclaimer: The information and opinions shared are for informational purposes only including, but not limited to, text, graphics, images and other material are not intended as medical advice or instruction. Nothing mentioned is intended to be a substitute for professional medical advice, diagnosis or treatment.




Not sure you’re aware, but the time between getting your shot and being considered vaccinated is two weeks. So the deaths in between those two weeks are said to be reported as unvaccinated individuals. Something to research and possibly factor in to the data. If this is the case it is more of an outrage.
Carlo Brusa :
70 % des parents contre la vaccination des enfants, 36 % des Français non “complètement” vaccinés !
https://echelledejacob.blogspot.com/2021/12/70-des-parents-contre-la-vaccination.html
Chevalier Orange
@ChevalierOrang2
Les non vaccinés ne sont pas 9% mais plus de 35%. Ça a fuité sur santé publique France et la DEES. Le pouvoir le sait. Leurs mensonges sont de plus en plus gros. Les gens comprennent. La Guadeloupe montre la voie. Les français ne sont pas soumis mais patients.
10:41 AM · 26 déc. 2021
https://twitter.com/ChevalierOrang2/status/1475038928084381699
Some say this is a fake document :
Brusa Carlo Alberto
@cab2626
Inutile de me signaler je ne suis pas vacciné et il faudra m’abattre ! Ce n’est pas là fascisme ? C’est pire ……….Vivre sans vaccin ou mourir pour la liberté ! Il n’y a qu’une seule réponse mourir pour la liberté !
Image
https://twitter.com/cab2626/status/1475572965190295564