


Vaccines are taking an average of 5 months to kill people
The CDC has been hiding the Social Security Administration death master file. I got it from a whistleblower. This shows deaths are taking 5 months from the jab to happen. This is why it’s hard to see.
 STEVE KIRSCH
Executive Summary
We’ve always assumed the vaccine kills you quickly (in the first two weeks) because that’s when people notice the association and report it to VAERS. This is still true; it does kill some people quickly.
However, thanks to an HHS whistleblower, we can now clearly see that most of the deaths from the vaccine are happening an average of 5 months from the last dose. That is for the second dose; it may be getting shorter the more shots you get, but there are arguments both ways (since there can be survivor bias).
But this explains why the life insurance companies got off-the-charts all-cause mortality peaks for people under 60 in Q3 and Q4 rather than right after the shots rolled out.
The five month delay is also consistent with death reports where people are developing new aggressive cancers that are killing them over a 4 to 6 month period.
The 5 month death delay was also confirmed using only European data. That analysis was posted Aug 11, but I learned about it after I wrote this post.
So when you hear of a death from stroke, cardiac arrest, heart attack, cancer, and suicide that is happening around 5 months after vaccination, it could very well be a vaccine-related death.
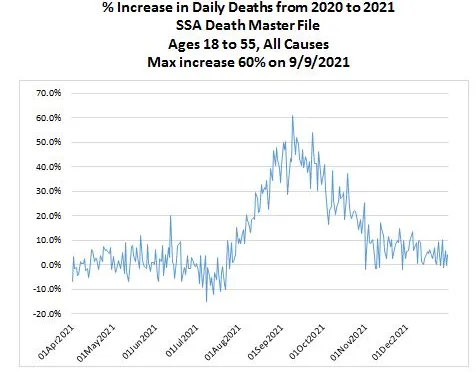
The data from the Social Security Administration death master file (ages 18 to 55)
I got this chart from a whistleblower who works for HHS. This is data you are not supposed to see. The mortality increase (60% at peak) is huge. That sort of increase can only be caused by something novel that affected massive numbers of people.
There is only one possibility that fits that: the COVID vaccine.
The peak is September 9, 2021.
.
Daily vaccine doses administered in the US
The peak is April 12, 2021.

.
Occam’s razor
The most obvious conclusion is that the vaccine takes an average of 5 months to kill people after the second dose.
The second peak in December 2021 will result in life insurance companies having spikes in Q1 and Q2 of 2022.
Here’s what UK Professor Norman Fenton said

Another analysis using only European data found the exact same 5 month delay!
An analysis posted at Chris Martenson’s site found the same 5 month delay using different source data! That is really stunning. I had no idea when I wrote my article.
Here’s the reader comment pointing this out and here’s the comment on Peak Prosperity posted August 9, 2022 which was just a few weeks before I found the same thing from the US data.

DaveDD’s full post on Peak Prosperity
What the figure shows is the “correlation coefficient” as function of a temporal delay, that is, time shift.
- a negative time shift indicates that excess mortality is preceding the vaccination status
- a positive time shift indicates that the administered doses precedes the excess mortality
The optimal time shift is defined as that time shift that maximizes the absolute pearson coefficient. We search for the highest, or the lowest value. The lowest value is around -0.3, while the highest value is around 0.8. Because the absolute value of the highest,+0.8, is larger than the absolute value of the lowest, +0.3, the optimal time shift is + 5 months. That is, Administered Doses precedes Excess mortality.
As Holden indeed mentioned, we do find a negative relation also when there is no shift. However, the explanatory power of +0.8 is way larger than -0.3.
The reason why I used “causes” instead of causes is that there are several characteristics of causal relations. What we tested now is “temporal precedence”. An effect cannot precede the cause, plus, a cause predicts the effect better than the cause predicts the effect.
In the cause of observational causality, another important aspect is that the cause should predict the effect better than the effect predicts itself. In this case we indeed find that Excess Mortality predicts itself poorly —of course, for a time delay equal to 0, it does predict itself, for all other time delays, it has little to no explanatory power—.
From this we can conclude that, based on the data sets used, Administered Doses do cause Excess Mortality.
Of course, our “brilliant experts” are still stuck in the 19th century wrt statistical methods. I do not expect that they will be able to explain the excess mortality with their current methods, simply because 5 months is a huge time delay, and because here is typically little knowledge of observational causal methods.
About the method
The method used is based on correlations. The current state-of-the-art is based on Information Theory, but that’s too out of the ordinary for layman, and even experts, so we better not go there. When I have time in a couple of weeks I might run the information theoretical causal analytics.
About the data
As mentioned, the data sets from Holden’s sources were used. We selected only EU countries, we did not differentiate between sexes and age groups. Finally we used monthly data due to time restrictions on my side (I simply do not have time to search for, or create weekly data sets for the excess mortality).
Alternate hypotheses
If someone has a better explanation for this data, I’d love to hear it.
It does appear from reading the comments that it makes sense to reader and explains what they personally observed.
If any fact checker wants to challenge me on this, you can use the Contact Form and let’s have a recorded conversation.
The CDC doesn’t want to talk about this. They also won’t tell us why they aren’t showing us this data.
For sure, the NY Times and rest of the mainstream media will ignore this and won’t ask any questions. Maybe Tucker Carlson will talk about it.
Implications for the Canadian doctor death data
Armed with this new knowledge, we should stop looking just for deaths proximate to the vaccine and look at the overall death rate in Canada of young doctors, e.g., doctors 50 and younger. What I found when I did that is that the number of young doctor deaths in Canada increased by a factor of 2.5X in 2021 vs. 2020 (15 deaths vs. 6). I’ve requested the data for earlier years to see how this compares
Summary
It was wrong to assume that most of the vaccine-related deaths were happening shortly after vaccination. Some are, but most are not. It’s just that they were easier to notice when there was temporal proximity to the jabs.
If someone you know died around 5 months after vaccination, you should definitely have a proper autopsy done as described in my earlier interview with Ryan Cole.
Please share this info.
************
Source

••••
The Liberty Beacon Project is now expanding at a near exponential rate, and for this we are grateful and excited! But we must also be practical. For 7 years we have not asked for any donations, and have built this project with our own funds as we grew. We are now experiencing ever increasing growing pains due to the large number of websites and projects we represent. So we have just installed donation buttons on our websites and ask that you consider this when you visit them. Nothing is too small. We thank you for all your support and your considerations … (TLB)
••••
Comment Policy: As a privately owned web site, we reserve the right to remove comments that contain spam, advertising, vulgarity, threats of violence, racism, or personal/abusive attacks on other users. This also applies to trolling, the use of more than one alias, or just intentional mischief. Enforcement of this policy is at the discretion of this websites administrators. Repeat offenders may be blocked or permanently banned without prior warning.
••••
Disclaimer: TLB websites contain copyrighted material the use of which has not always been specifically authorized by the copyright owner. We are making such material available to our readers under the provisions of “fair use” in an effort to advance a better understanding of political, health, economic and social issues. The material on this site is distributed without profit to those who have expressed a prior interest in receiving it for research and educational purposes. If you wish to use copyrighted material for purposes other than “fair use” you must request permission from the copyright owner.
••••
Disclaimer: The information and opinions shared are for informational purposes only including, but not limited to, text, graphics, images and other material are not intended as medical advice or instruction. Nothing mentioned is intended to be a substitute for professional medical advice, diagnosis or treatment.


